Your single point of reference for all your Geotechnical Inquiries
ROTOMAP
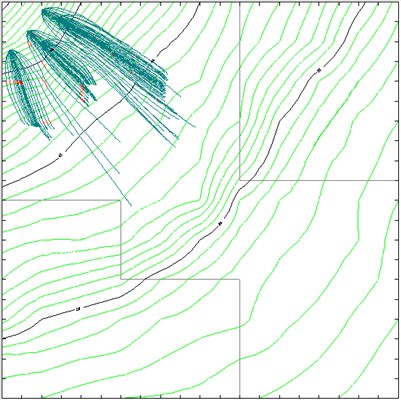
ROTOMAP is a three-dimensional model that is used for rockfall analysis and the design of rockfall protective systems.
This module belongs to the Isomap family: please check the ISOMAP page for a complete description of the main module features.
ROTOMAP uses a statistical approach; it simulates a large number of rockfalls and, through the analysis of the distribution of the average and maximum kinetic energies, identifies the optimal areas for the installation of the protective systems.
The program requires a detailed topographic map and a geomorphologic data collection to identify the areas where a rockfall can initiate, and to distinguish the different surface types, such as clean faces of hard unweathered rock or surfaces covered in talus, scree or gravel material.
A digital terrain model can be obtained from an arbitrary distribution of points (X,Y,Z), that the program can convert into a regular grid, or by directly assigning the elevation values to the nodal points of the square mesh that is used in the model.
It is also possible to import the elevation values from an external digital terrain model.
A new, fast model calibration method is now available, thus avoiding carrying out expensive tests with high-speed cameras.
ROTOMAP draws the contour lines of the minimum travel times of the blocks; with a simple chronometer and a standard video camera it is possible to compare the real and simulated times, in correspondence to pre-determined check-points.
This allows a detailed and reliable calibration of the model.
If in-field tests are not possible, a preliminary back-analysis stage can be used to determine the restitution and friction coefficients.
These coefficients can be obtained through a comparison of the points where the rock blocks stop in the simulation with the rockfall history stop points.
The kinetic energy distribution is thus calculated and this permits both the optimal positioning and the accurate design of barrier fences or catch benches.
The maximum bouncing height over the slope can also be drawn. This allows the selection of the correct size of the barrier fences.
In this way, the effectiveness of the whole rockfall protective system can be verified.
The program can generate printouts of the topographic map, rockfall trajectories, kinetic energies, distribution of stop points and the vertical sections of each simulated fall.
Italy


