Your single point of reference for all your Geotechnical Inquiries
BOREHOLE IMAGE ANALYSIS
DATA IMPORT
Borehole image data from a variety of tools including acoustic televiewer, optical televiewer, corescanned images, FMI, FMS, CAST, CBIL, UBI and STAR and Sondex MIT are supported.
For data available in LIS/DLIS format files, you will have to use the LIS/DLIS add-on module.
DATA PROCESSING
Before any form of analysis is performed, the data needs to be processed.
This involves the creation of a reliable high quality image from raw tool measurements. It consists of a number of procedures.
• Log quality control (check both image and orientation measurements)
• Reconstruction of the data for variation in tool properties or at acquisition time
• Corrections of the actual measurements
A number of processing options are available for enhancing the quality of the data.
These includes
• Bad trace interpolation
• Amplitude normalization
• Despiking filters
• Correction of decentralisation
• Image orientation
DATA PRESENTATION
Data presentation
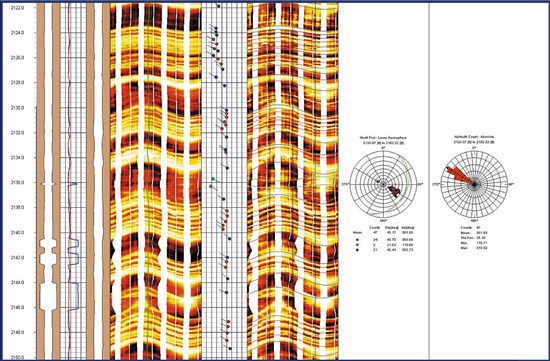
Data can be displayed as an image (user definable image color palette), as curves (shifted or stacked curves) or as 3D cylinder display (mimic a virtual core)
Data can be visualised as 3D images using 3D borehole view (ideal to visualise breakouts, well deformation, pipe corrosion)
DATA INTERPRETATION
Any number of sinus curves can be interactively picked recording azimuth and dip values.
Each pick can be qualified into user definable categories (ToadCAD)
Picks can be displayed as sinus, tadpole or stick plot.
Fully interactive structure interpretation including polar and rose diagram.
Luxembourg


